
Contents
What is the Gantt Chart?
Even before understanding what the best features of this tool are, it is essential to know its concept, do you agree? Developed by Henry Gantt at the beginning of the 20th century, the instrument is characterized as a bar graph that visually organizes the schedule of a given project, that is, with colors and objective information.
Thus, it lists all the activities that need to be performed on the vertical axis while illustrating the time intervals on the horizontal axis. In this sense, each activity has a horizontal bar that shows its duration. It is through this vinsualization that you can optimize management work.
We explain why: when shared with the team, this tool allows in-depth monitoring of each employee’s tasks, helping to identify projects that are in progress and their expected completion. When we think about the sphere of maintenance, it becomes much easier to leave the corrective work and invest in the predictive and preventive.
Is there a relation between the Gantt Chart and project management?
We cannot deny that the Gantt Chart has undergone a great evolution in recent years. With its roots in the 19th century, the tool originated from an ancient management strategy: harmonogram. In this case, it only organized the workflow of each employee, even though it allowed the entire team to monitor the activity progress.
It was, then, with Henry Gantt that the harmonogram became a more efficient tool, and today many people adapt it to meet the demands of their organization. This means that it is highly flexible and can be applied in different contexts, from administrative to financial and personal.
Well, what is the relation between it and maintenance project management? Today, many companies seek to optimize the working time of each employee, as well as manage their functions correctly in order to maximize the available resources. The Gantt Chart, then, became an excellent alternative to bring this up.
It is through its features that the team identifies the most suitable employee to assume responsibility for a given task, avoiding overloading other colleagues and positively exploring the skills of all professionals.
What are its features?
In the last topic, we commented that the features of this tool allow the delegation of tasks by identifying the potential of each professional, remember? This is because it provides an easy view of the paths to be followed, whether for maintenance tasks or for other teams involved in the project.
Thus, the Gantt Chart allows the manager to make decisions quickly, stimulating their logical reasoning in work, team breaks and, of course, the availability of material resources to correctly perform each activity. So, you can easily check the following processes:
- starting date of the project;
- what are the tasks of the initiative;
- who is working on each task;
- when tasks start and end;
- how long each task will take;
- how tasks are grouped, overlapped, and linked to one another;
- project completion date.
To analyze all this, there are several features present in the chart. In the next topics, we will explain the most important ones that will help your company to enhance maintenance management.
Organization of activities
We have already explained that all project tasks, when applied in the Gantt Chart, are segmented in an organized way to allow the visualization of their development and performance, as well as the deadline for completion. This small attitude breaks down each step of the project, making it easy to identify mistakes and successes.
This will support future strategies, as you will be able to analyze which activities were not well performed — and their reasons — in addition to highlighting the skills of each professional responsible for their task. Gradually, this management takes shape and the work gains recognition.
Task Distribution
Being able to identify who is responsible for the project stage is an advantage that few instruments offer. In addition to delegating activities, the manager can encourage collaboration among the team, making each professional responsible and, consequently, feel motivated to deliver a good job.
Deadline planning
Setting deadlines provides an efficient control of activities, both for the manager and the employees. The Gantt Chart then allows to identify time intervals for each task, favoring the prioritization of certain attitudes so that the project is completed with perfection, in addition to highlighting maintenance indicators.
Also, with its constant use, you gain work optimization tools, as you can identify the best ways to structure a task, delegate functions and set deadlines. This avoids bad date scaling and ensures efficient work.
Staff integration
To conclude, we could not forget about team integration. With the transformations of the Gantt Chart, many companies have adopted it as a tool to bring professionals together. After all, most organizational projects demand a link between different departments, creating interdependent activities.
Thus, with this tool, all employees can monitor the status of the initiative, controlling the schedule and helping the professionals responsible for the current stage. As a result, we have a healthy and motivated group that knows how to easily work as a team.
Benefits of the Gantt Chart
We talked a lot about planning and organization of maintenance with regard to preparing activities to be performed in the future, near or not. The Gantt chart is an important visual tool that allows the entire planning process to be done with more clarity, objectivity and organization of the day to day maintenance.
The Gantt Chart brings more clarity to the processes, as it is possible to gather several maintenance information in a single place, thus making it easy to understand the entire process.
Another benefit that we can cite from the Gantt Chart is the optimization of time for managers. With all the information gathered, the visualization and resolution of problems takes place in a much shorter time than with loose and unconnected information. This way, the activity organization is done in a more assertive way.
For maintenance managers, being able to view all parts of the project in a more organized way helps them make decisions that can be more focused according to the information.
How does Engeman® use the Gantt Chart?
Faced with so many benefits, it is common to question how companies use this device. In Engeman®, the Gantt Chart is indicated for any project that presents tasks arranged in time, that is, that have a defined beginning and end. Thus, you can view and reschedule the Work Order (WO) control through daily, weekly or monthly illustration.
For example, the tool offers a tab where you can choose the filters to be displayed on the platform. So, if you want to search for a scheduled date for the WO, just select the display method (chronological or timeline). Going further, you can also determine the grouping model displayed by choosing between:
- application and its location;
- performing sector;
- employee in charge;
- position of the person in charge.

Even though maintenance planning is the most advanced in the world, the probability of it being 100% adjusted is remote and we will always need to work on the services already generated to change a running date, associate an available person to the service, among many other external variables that can impact daily performance.
To do so, we can also count on Engeman®, because functions such as WO Viewing/Reprogramming in Gantt, for example, can bring this practicality to the hands of maintenance analysts who will be able to view the jobs in sequence, identify if there are already workforce scheduled for performance or if it is already being performed, reschedule the start or end times of services and even a complete change of period.
In the image below, you will be able to view a WO Gantt schedule in the Engeman® software:
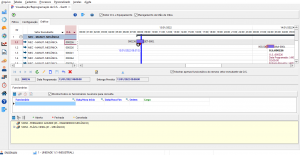
Figure 1 – Gantt Chart View -Client/Server
In Engeman® it is also possible to have access to this information through the Web, with access from anywhere:
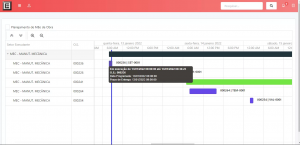
Figure 2 – Gantt Chart View – Web
Although it is a challenge to invest in strategies that optimize the work process, such as the delegation of tasks, the good management of organizational resources and the automation of services, the Gantt Chart is an excellent alternative that enhances your performance. By allowing the illustration of projects in progress, it enables the construction of efficient activities that show a clear path to be followed.
And see, this is just one of the features that can be used to manage the day to day maintenance. To see more, contact us and request a demo!


